FlowCytometryTools
Authors: Jonathan Friedman and Eugene Yurtsev
FlowCytometryTools is a python package for visualization and analysis of high-throughput flow cytometry data.
- Intuitive: provides a simple programmatic interface to work with flow cytometry data
- Flexible: can analyze either individual samples or collections of many plates
- Scalable: simplifies analysis of high-throughput data using the power of pandas
Who is this for?
FlowCytometryTools is for researchers who want to use the python programming language to analyze flow cytometry data.
The package is specifically tailored for high-throughput analysis. It provides an interface that can directly work with collections of flow cytometry measurements (e.g., 96-well plates).
Basic familiarity with the python programming languages is recommended.
You can find a few example scripts that load and plot flow cytometry data in the gallery page.
If you like what you see, then proceed to the installation page and then to the tutorial.
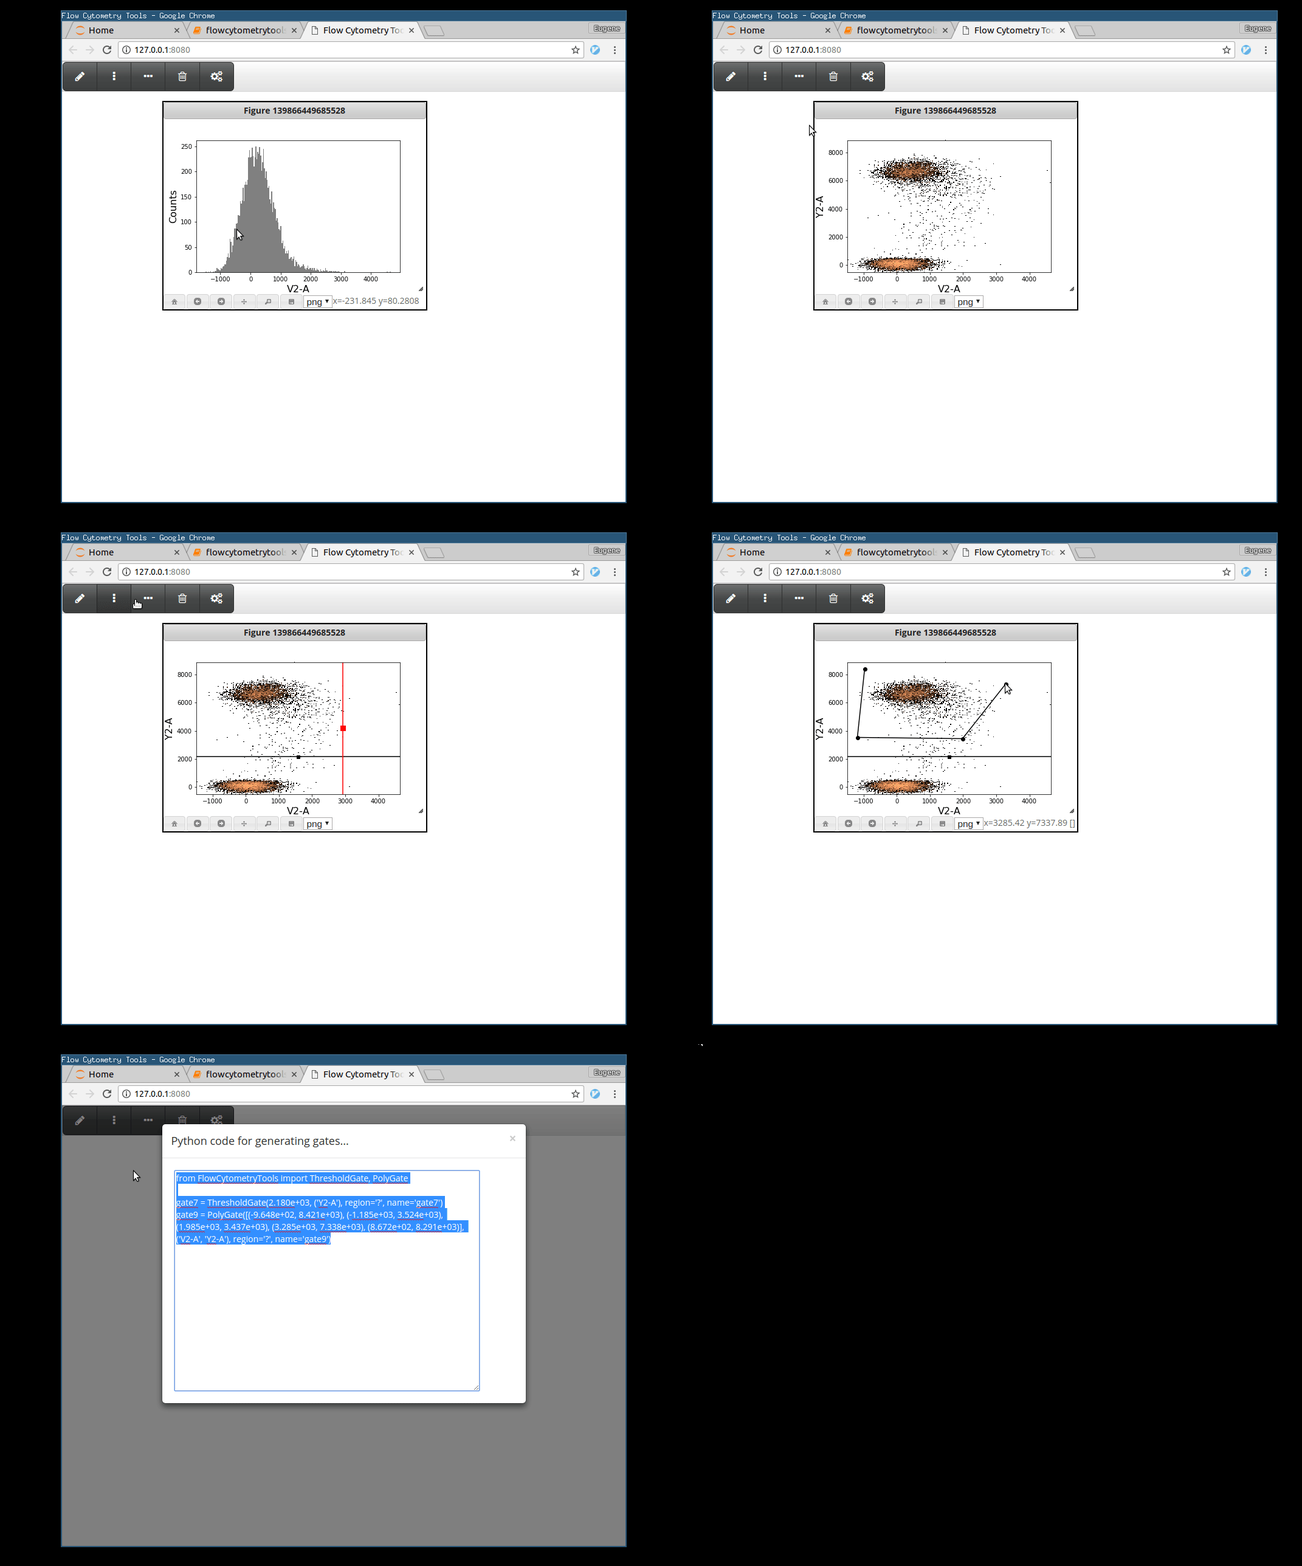
And yes, there’s a UI to draw basic gates. It’s super basic, but it gets the job done.


Features
- Transformations: hyperlog (hlog), truncated log (tlog), or anything you can dream of ;)
- Plotting: 1D, 2D histograms for both single samples and collections (e.g., 96-well plates).
- Gating: threshold, interval, quad, polygon gates
- Subsampling: easy to subsample to examine only part of a measurement and randomize event order
- GUI: simple graphical user interface to draw gates (wx or webagg)
- FCS Formats: Supports FCS 2.0, 3.0, and 3.1
Resources
- Documentation: https://eyurtsev.github.io/FlowCytometryTools/
- Source Repository: https://github.com/eyurtsev/FlowCytometryTools
- Comments or questions: https://github.com/eyurtsev/FlowCytometryTools/issues
Dependencies
For more information about how to obtain these, please see the installation page.
FlowCytometryTools may work with older versions of some of these dependencies, but if you run into issues, please update the dependencies.
Required Dependencies
- python python 2.7 or python 3
- pandas (Recommended version: 0.19.0 or higher).
- matplotlib (Recommended version: 1.5.3 or higher).
- scipy
Optional Dependencies
- wx-python : Used for the FlowCytometryTools GUI.
Alternatives
FlowCytometryTools is not the only open source software for performing data analysis on flow cytometry data.
So if you find that FlowCytometryTools does not suit your needs, take a look at the following software:
- cytoflow: API for python with a GUI
- fcm : API for python
- Bioconductor : API for the R programming language
- FlowPy : GUI
- cyflogic : GUI
- Flowing Software : GUI
Changes
v0.4.6, 2017-03-26
- FIX: edge case for inferring x-range for spline interpolation when doing log transforms and with data the contains values in the interval.
- FIX: fix linear transform (kwargs weren’t being passed correctly).
- FIX: interval gate was raising exceptions for certain numpy versions (fix by alonyan)
v0.4.5, 2015-10-31
- Sample fcs files now included with installation
- Mostly maintenance (tests, configuration files, etc.)
v0.4.4, 2015-09-06
** Repository moved to github **
Enhancements:
- added an experimental web-based backend for drawing gates. Use FCMeasurement.view_inteactively(backend=’webagg’).
- col first enumerator for forming an ordered fcs file collection (Yoav Ram)
Bug fixes:
- FCPlate.from_dir ID_kwargs match against full path, not just filename (Nick Bolten)
- fcs parser can read larger fcs files and handles blank headers (Ben Roth)
v0.4.3, 2014-12-05
- ENHC: Automatically determine bin location when plotting plates.
- Fix for Accuri V6 FCS (Ben Roth)
- Fix for xlim/ylim when plotting 2d histograms
v0.4.2, 2014-10-08
- FCS parser can handle more formats
- Updated documentation
v0.4.1, 2014-09-13
- Bug fixes for GUI
- Now works with matplotlib 1.4.0
- Added documentation and examples to gallery
v0.4.0, 2014-06-05
- Updates in documentation
- Added experimental view() function
- Renamed old view() function into -> view_interactively()
- Added queueing to help when dealing with large quantities of data.
- Histogram plots should work with pandas (0.14.0) & matplotlib (1.3.1).
v0.3.6, 2014-02-11
- Mostly updates in documentation
v0.3.5, 2014-01-19
- Boost in speed for transformations on collections of measurements (like 96-well plates).
- Much of the documentation has been updated and improved.
- Improved GUI.
v0.3.0, 2013-10-27 Initial Release
LICENSE
The MIT License (MIT)
Copyright (c) 2013-2015 Eugene Yurtsev and Jonathan Friedman
Permission is hereby granted, free of charge, to any person obtaining a copy of this software and associated documentation files (the “Software”), to deal in the Software without restriction, including without limitation the rights to use, copy, modify, merge, publish, distribute, sublicense, and/or sell copies of the Software, and to permit persons to whom the Software is furnished to do so, subject to the following conditions:
The above copyright notice and this permission notice shall be included in all copies or substantial portions of the Software.
THE SOFTWARE IS PROVIDED “AS IS”, WITHOUT WARRANTY OF ANY KIND, EXPRESS OR IMPLIED, INCLUDING BUT NOT LIMITED TO THE WARRANTIES OF MERCHANTABILITY, FITNESS FOR A PARTICULAR PURPOSE AND NONINFRINGEMENT. IN NO EVENT SHALL THE AUTHORS OR COPYRIGHT HOLDERS BE LIABLE FOR ANY CLAIM, DAMAGES OR OTHER LIABILITY, WHETHER IN AN ACTION OF CONTRACT, TORT OR OTHERWISE, ARISING FROM, OUT OF OR IN CONNECTION WITH THE SOFTWARE OR THE USE OR OTHER DEALINGS IN THE SOFTWARE.
