
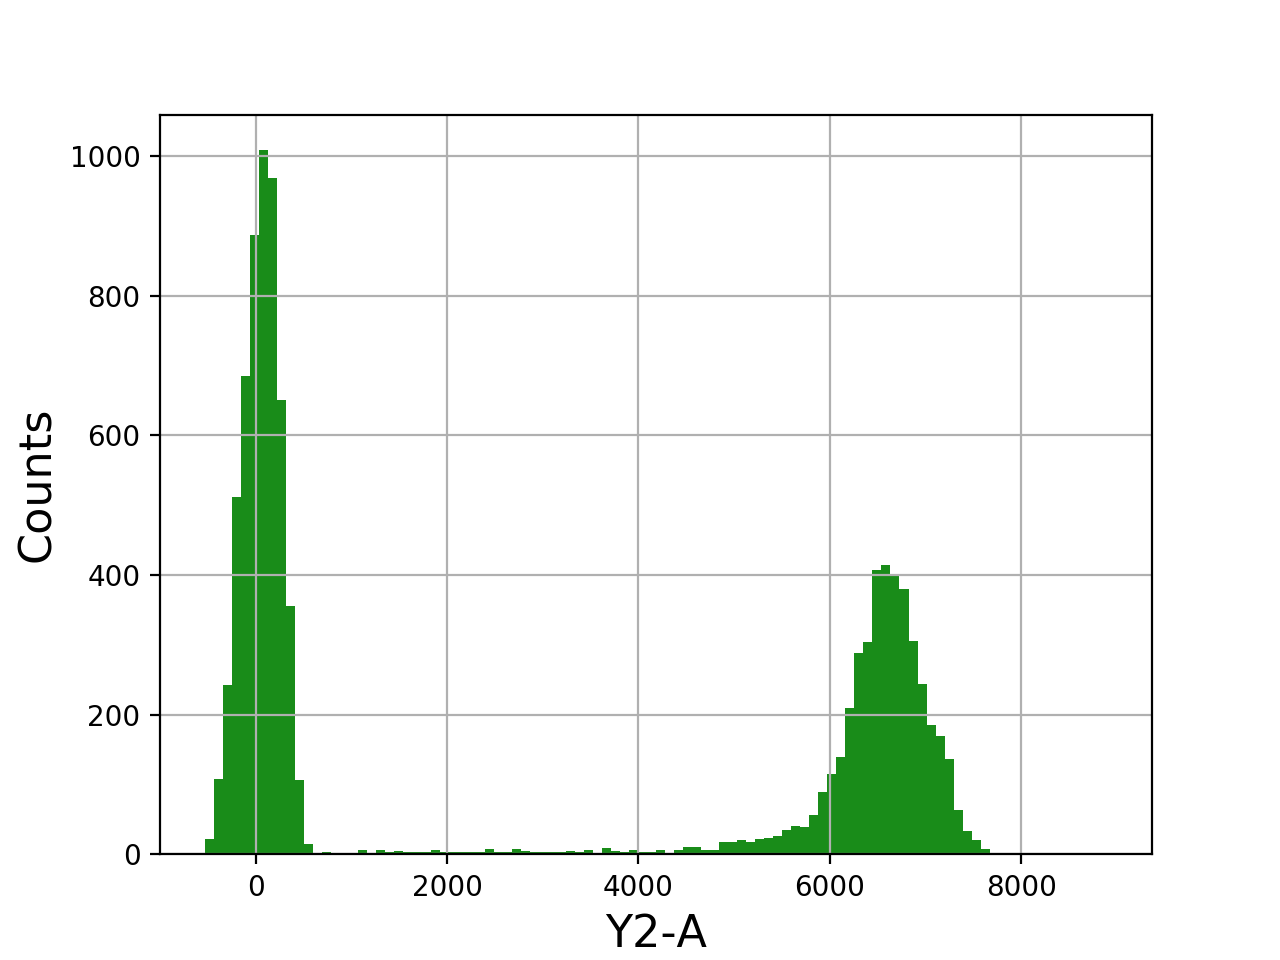
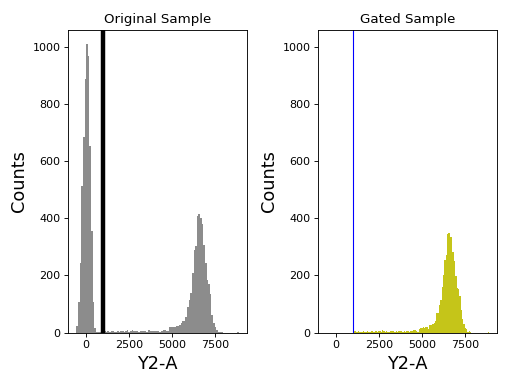
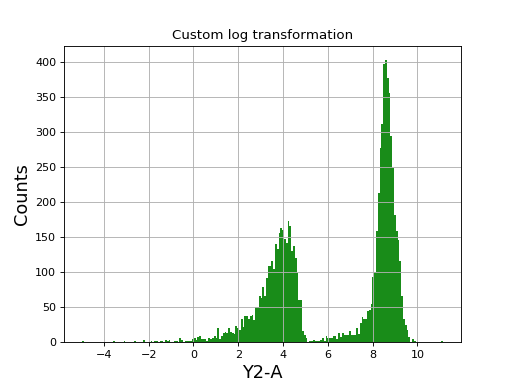
1d histograms
(Source code, png, hires.png, pdf)

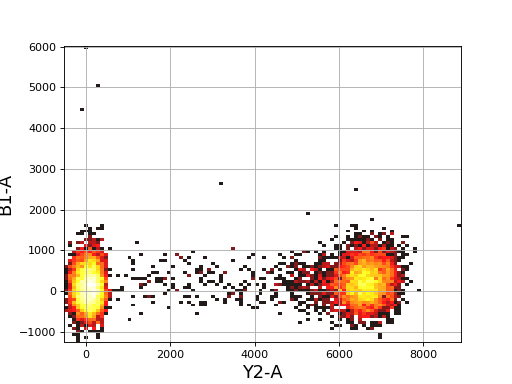
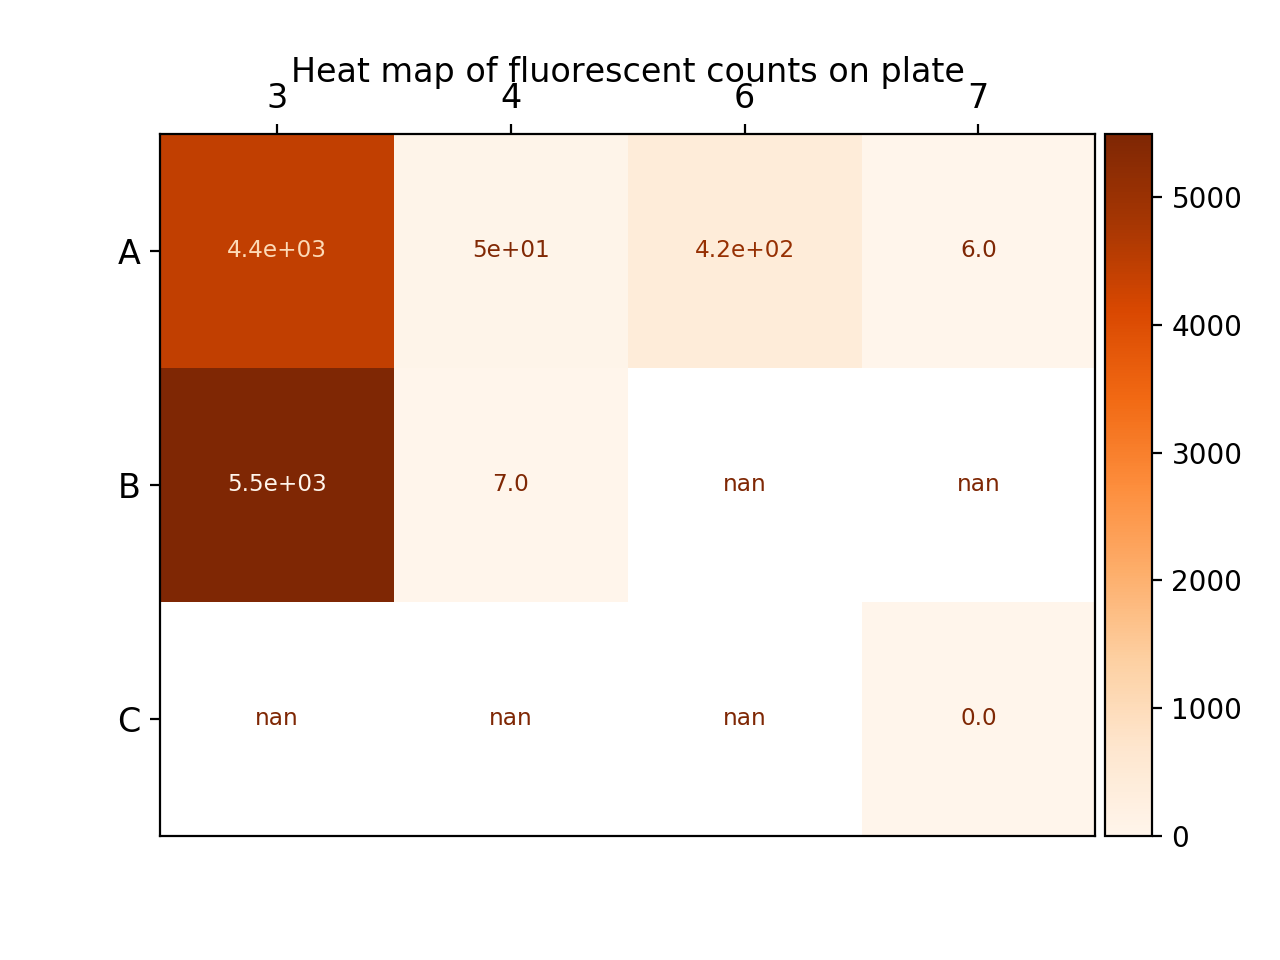
2d histograms
(Source code, png, hires.png, pdf)

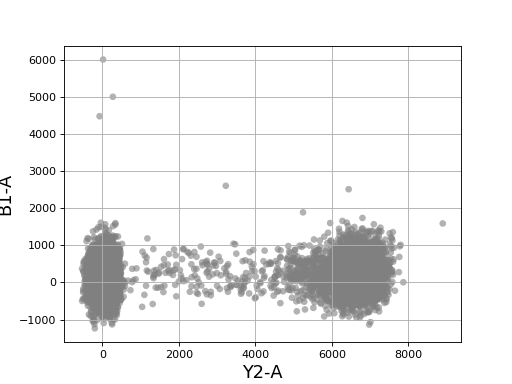
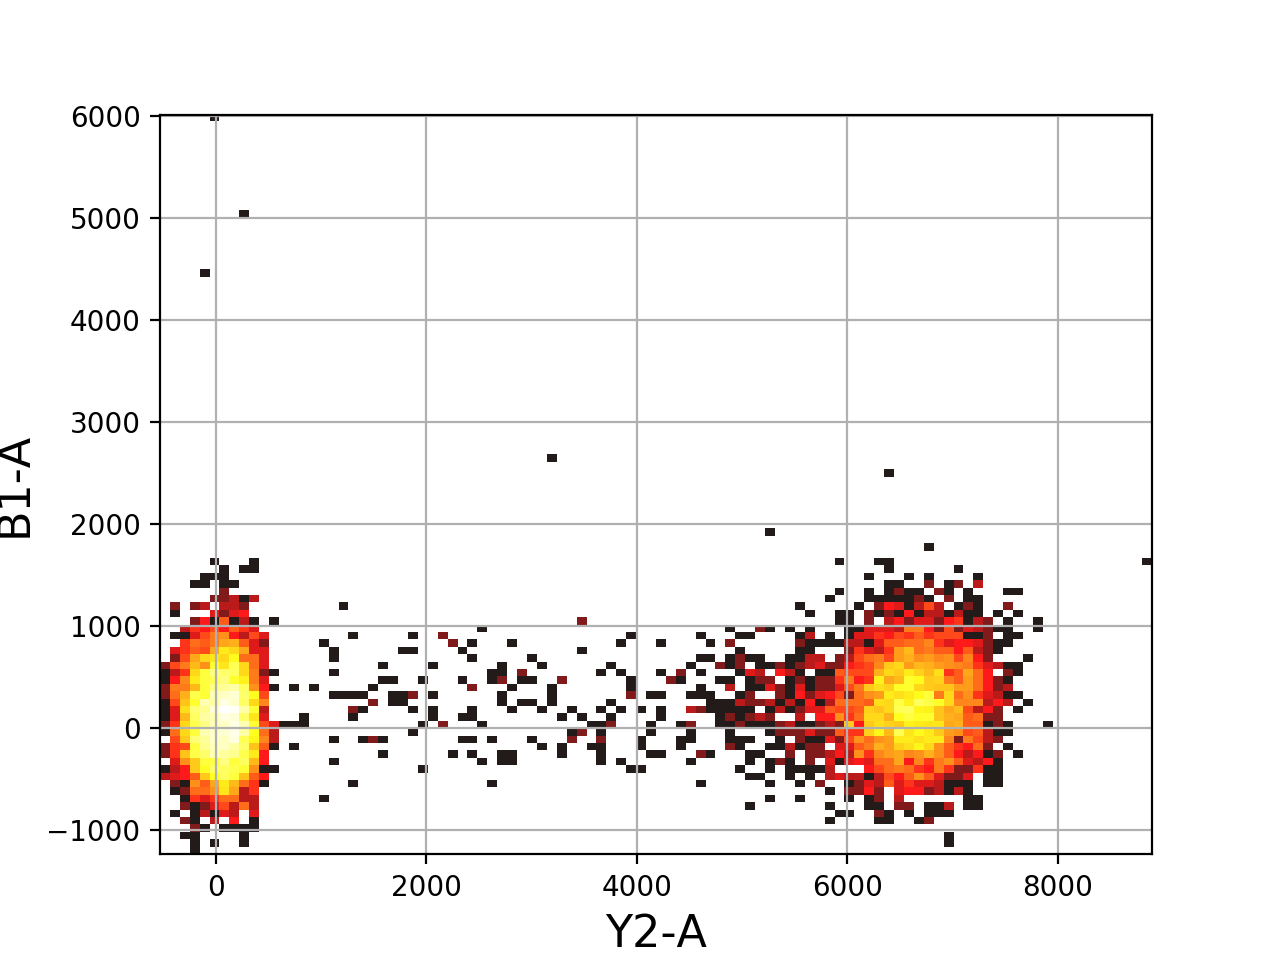
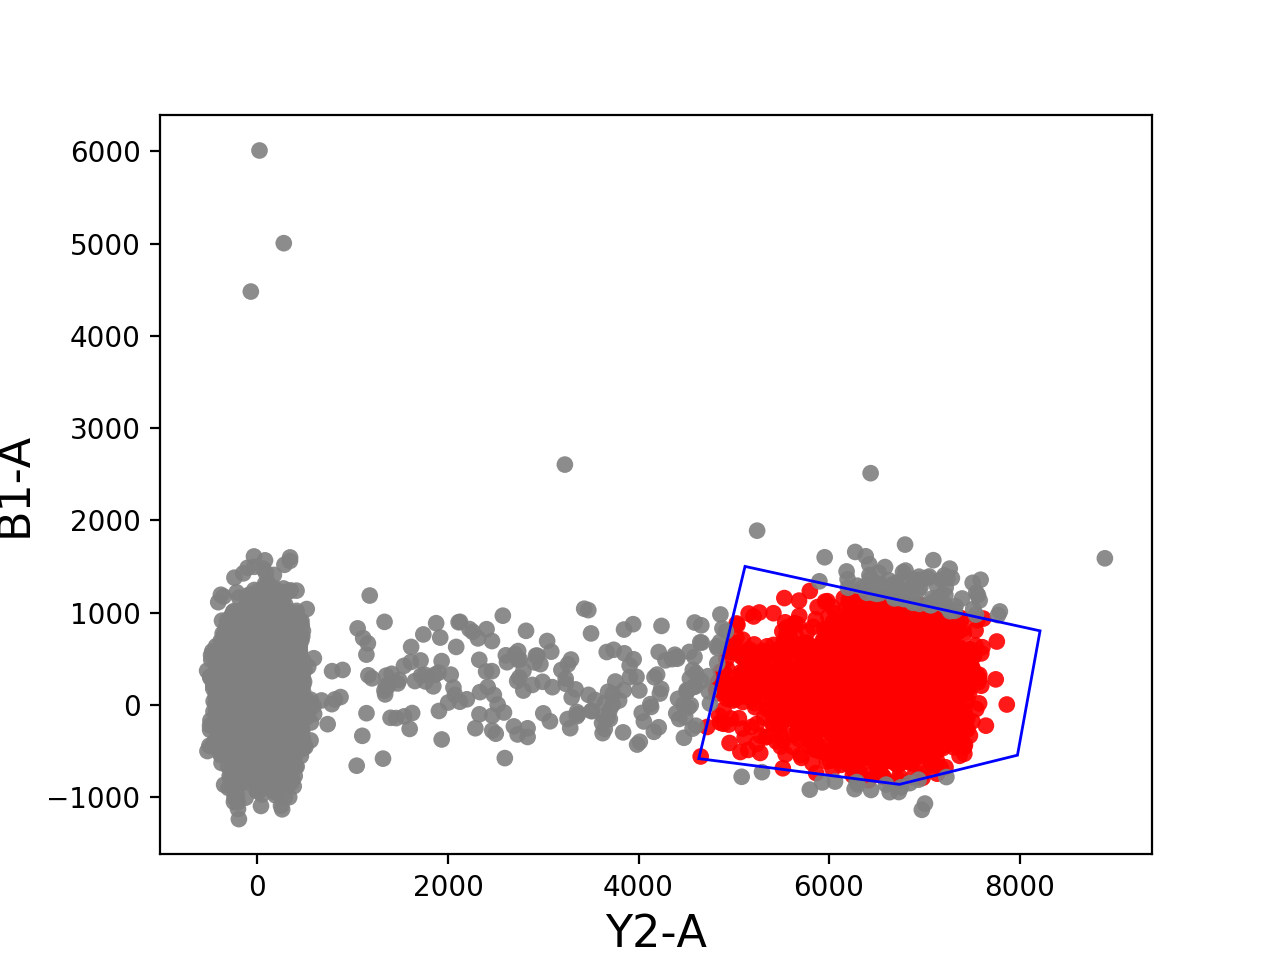
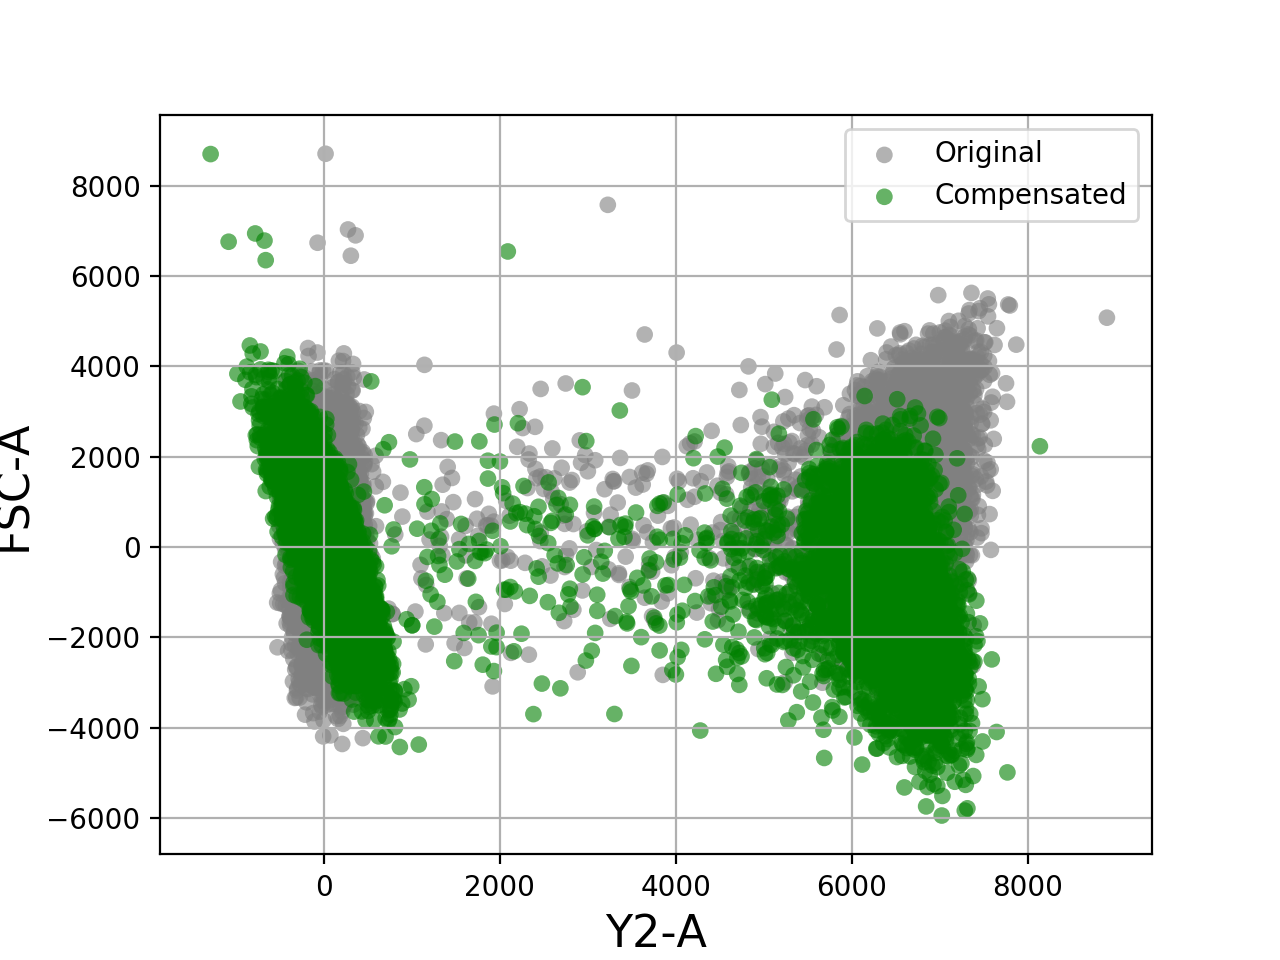
2d Scatter plot
(Source code, png, hires.png, pdf)
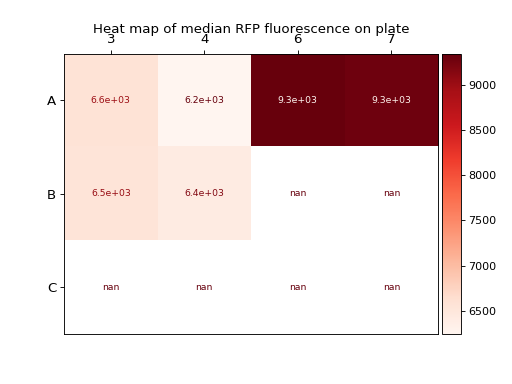
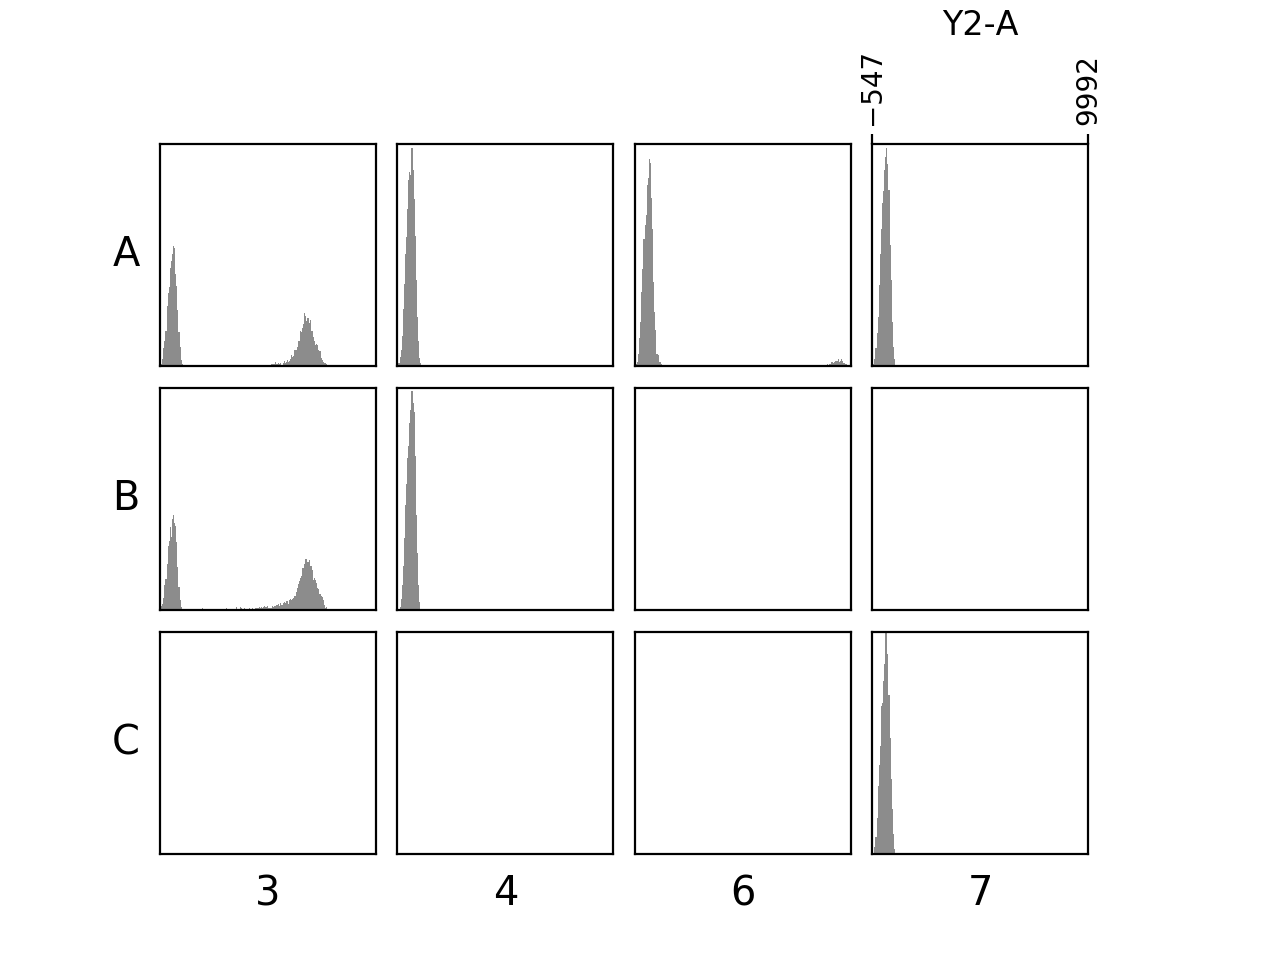
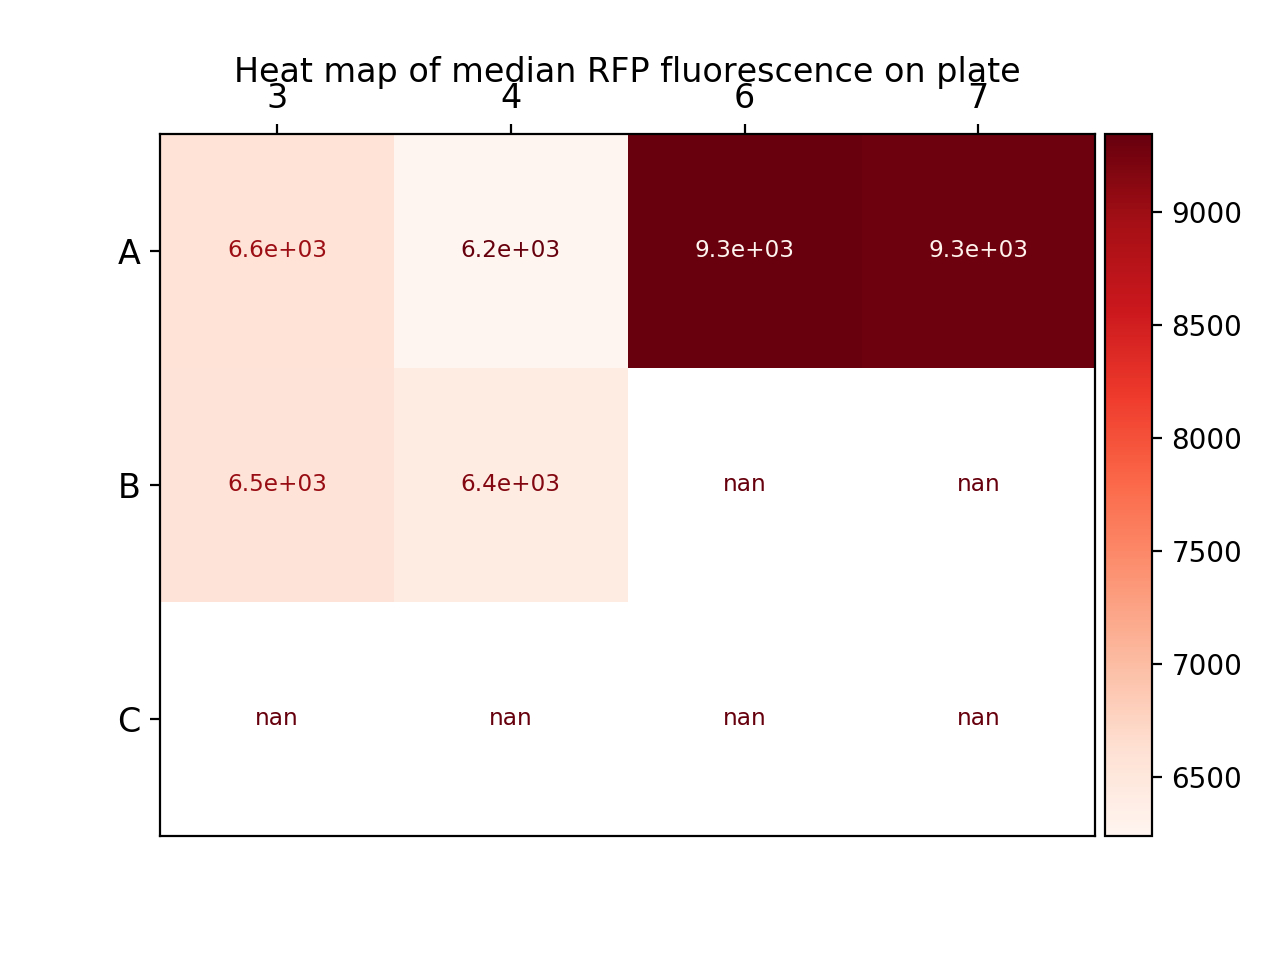
The following are examples of plots of data taken from 96-well plates.
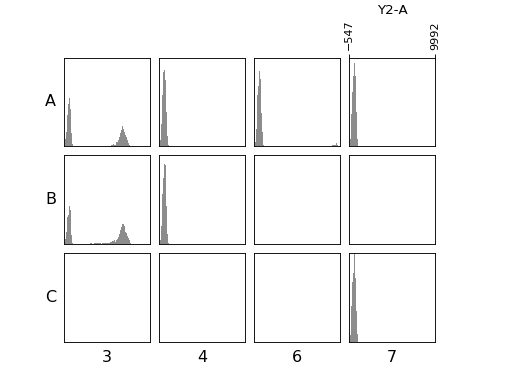
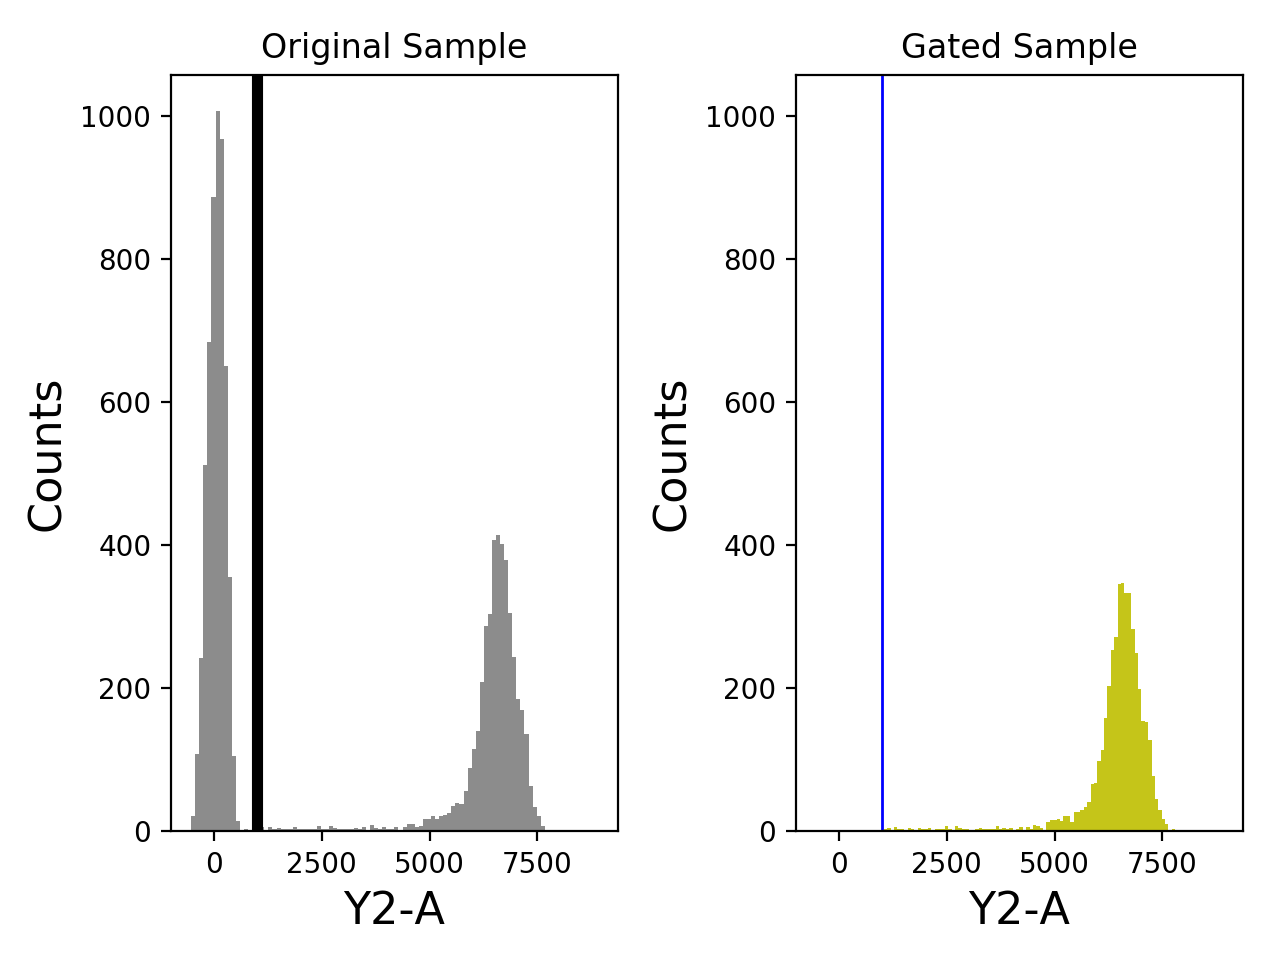
1d histograms
(Source code, png, hires.png, pdf)
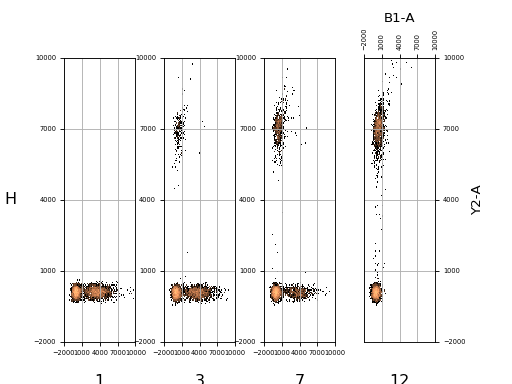
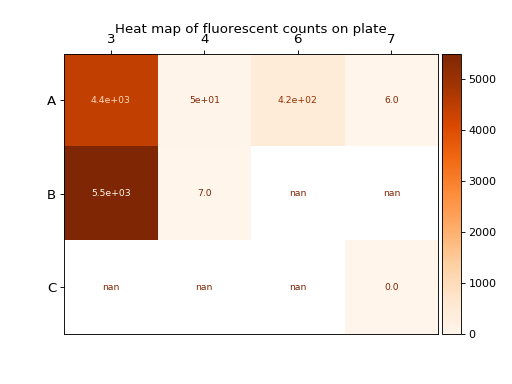
2d histograms
(Source code, png, hires.png, pdf)


